How to Assess the Quality of a TV Show With Facial Recognition Software
Nowadays, you can barely keep up with all the new TV shows appearing on any given streaming platform.
There’s mass content production that keeps increasing each year. Compared to just 6 years ago, when we had 455 adult-scripted original series produced annually in the US, last year we had a 23% increase, reaching 559 shows across cable, broadcast TV, and streaming services.
With so many shows, it’s difficult to separate the good from the bad, like finding a needle in a haystack. And these productions don’t come cheap. High-end cable and streaming dramas cost around $5 million-$7 million an hour, and half-hour single-camera shows run from $1.5 million to more than $3 million.
With so much content and high costs, tv production companies need the best content management they can get, or else they can easily fall into disgrace. Firms have to understand what their audience wants and see what works and what doesn’t. They have to put their content to the test before the official launch and avoid a financial disaster. They should also take measures to redeem any issues before it’s too late.
So what tools can help you make better creative and financial decisions for the TV’s audiovisual content? Here’s one you don’t want to miss: Alyze’s emotional recognition software. And we can prove it.
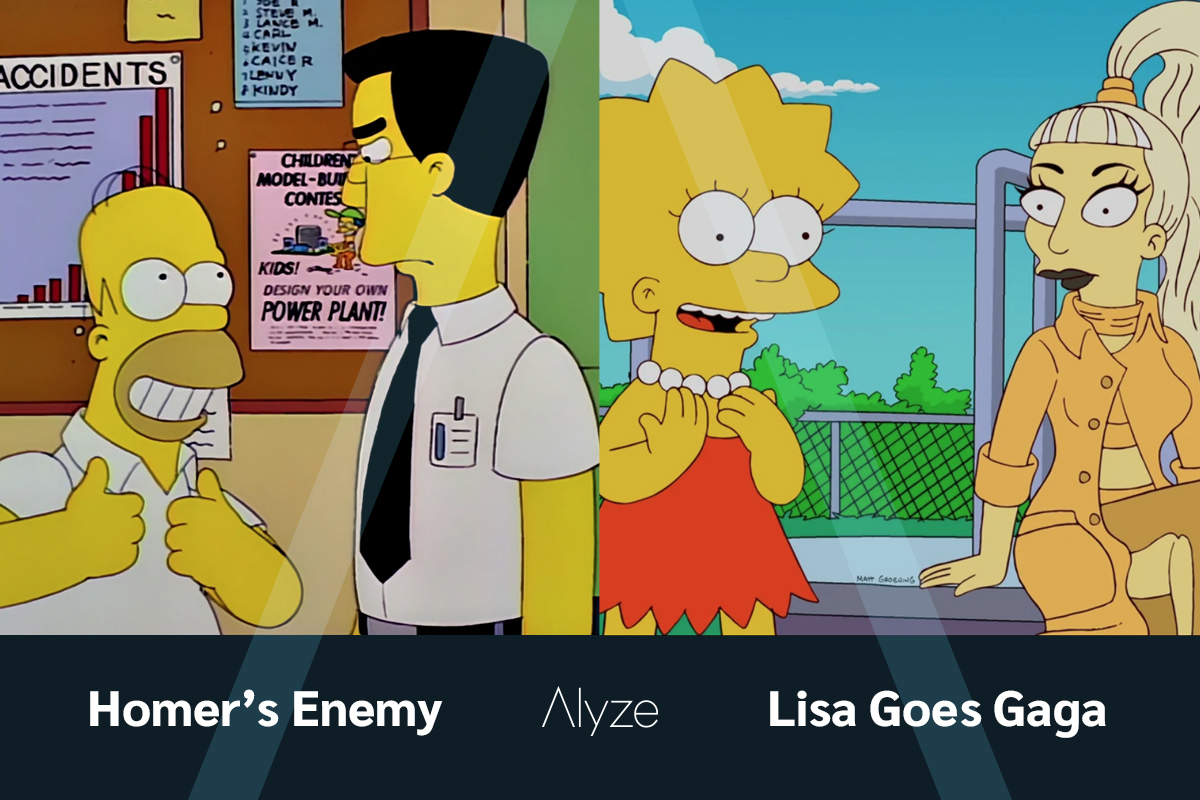
Comparing the worst and best episodes of The Simpsons
To assess our facial recognition tool we wanted to see if our software could detect emotional differences between The Simpson’s worst and best episodes according to the IMDB rating. We compared the episode Homer’s Enemy (9.3 ratings) and Lisa Goes Gaga (4 ratings) but our test subjects wouldn’t know which one was the best and worst.
Each participant watched both episodes while we registered their facial expressions and they responded afterward whether they thought each episode was considered the best or the worst one. We would then see if the emotional reactions and survey answers coincided with the episode ratings or not. Additionally, we wanted to see if there was a difference between participants above the age of 35 and below it, and between female and male participants to add more insights to our experiment.
The audience’s emotional reactions
After testing the content with 300 participants from Spain, we were able to extract some valuable insights.
General overview
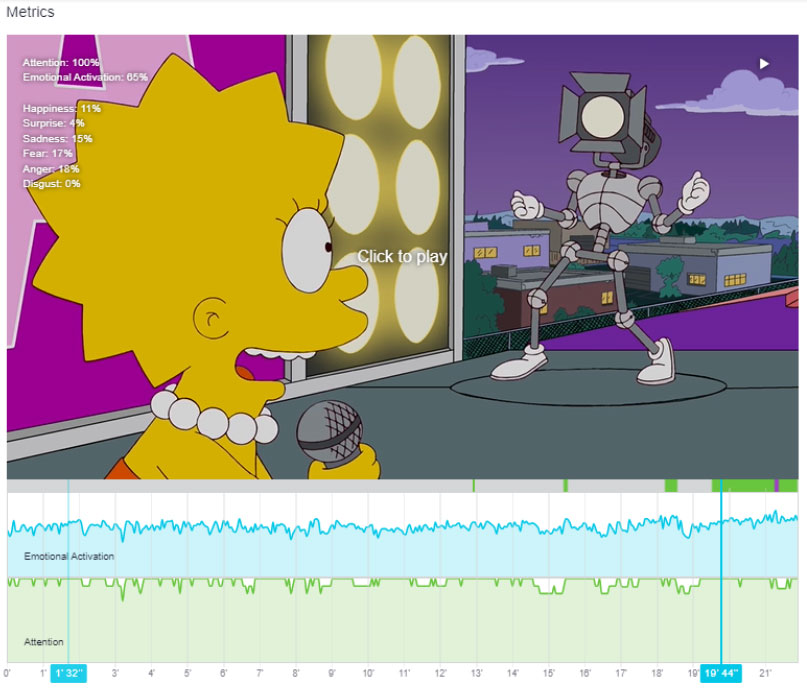
The first thing that stands out is the emotional distribution throughout the content’s duration. In “Homer’s Enemy” we see that the highest emotional reactions occur in the central portion of the episode, compared to “Lisa Goes Gaga” where they’re more concentrated in the episode’s ending.
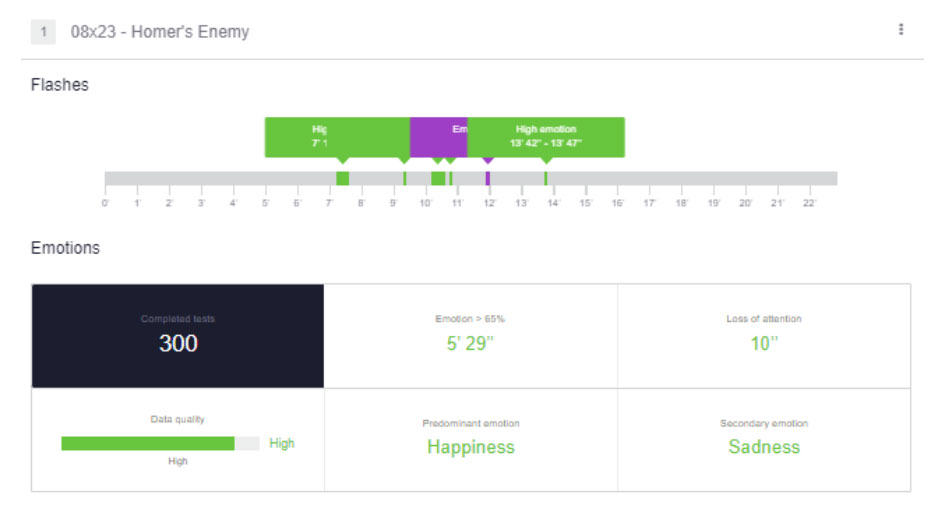
Next, we look at the emotional reactions that have surpassed the 65% threshold. The audience experiences accumulated more emotional reactions overall to “Homer’s Enemy” (5:29 min.) than to “Lisa Goes Gaga” (2:14 min.). This means that people expressed either one or more of the 6 emotions more intensely and for more time than in the former episode. Likewise, the accumulated loss of attention is lower for “Homer’s Enemy” (only 10 seconds) than the “Lisa Goes Gaga” (2 min.). This general trend already signals a higher preference for the “Homer’s Enemy” episode.
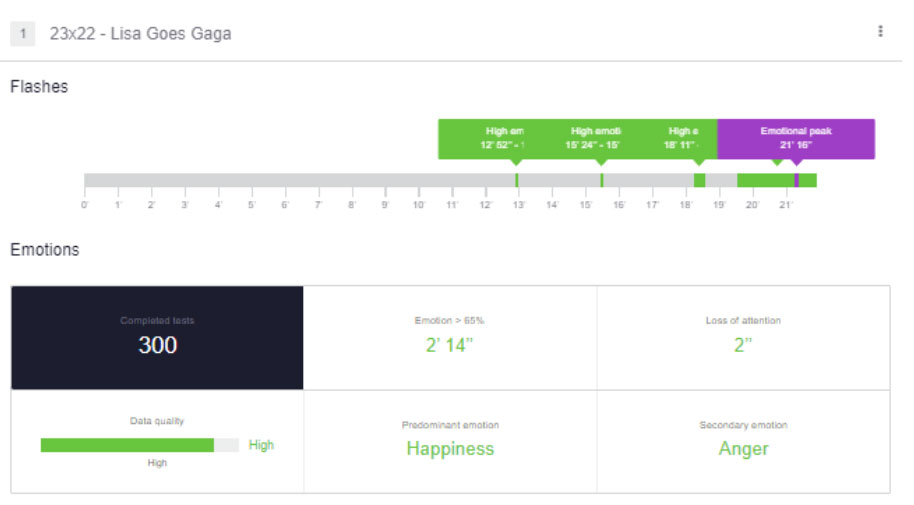
We also see that the main emotions differ between both episodes. In “Homer’s Enemy” the predominant emotion is happiness followed by sadness. Frank Grimes' story is miserable and the audience empathizes with him on certain occasions throughout the episode. On the other hand, “Lisa Goes Gaga” arises happiness predominantly but closely followed by anger. This might reflect people’s unwillingness to watch the episode or their negative reactions toward the comic scenes. Either way, the audience’s higher inclination towards negative emotions further shows the contrast between both episodes.
When we look at the emotional development throughout the episode we get some interesting results as well. We see that there are sharper and evenly distributed peaks in “Homer’s Enemy” while “Lisa Goes Gaga” tends to be flatter and emotions slightly increase towards the end. There are long sections with lower attention in the latter while the former only declines towards the end (where it’s expected due to the credits).
In both survey questions whether the episode is considered the best or the worst one, the audience easily distinguishes their preference. While in the “Homer’s Enemy” episode they’re inclined towards considering it the best one (with 64% preference) in “Lisa Goes Gaga” episode they’re even more convinced it’s the worst one (with 73% preference).
Combining data from the survey with emotional reactions helps you get a better understanding of your audience. We always encourage our clients to collect information from different tools (survey, behavioral response, emotional reactions, etc.) to contrast those responses and get a clearer overview of the situation.
Segment evaluation (age and gender)
We can compare the data by segmenting our audience into segments like age and gender, finding new elements worth mentioning for each episode.
Homer’s Enemy
People over 35 tend to see this episode more as a nostalgic view of their past (sadness as the predominant emotion) but that doesn’t mean they don’t enjoy it (happiness as the secondary emotion). Their emotional reactions are more prominent in the first half which shows they’re more engaged in revisiting something from their past.
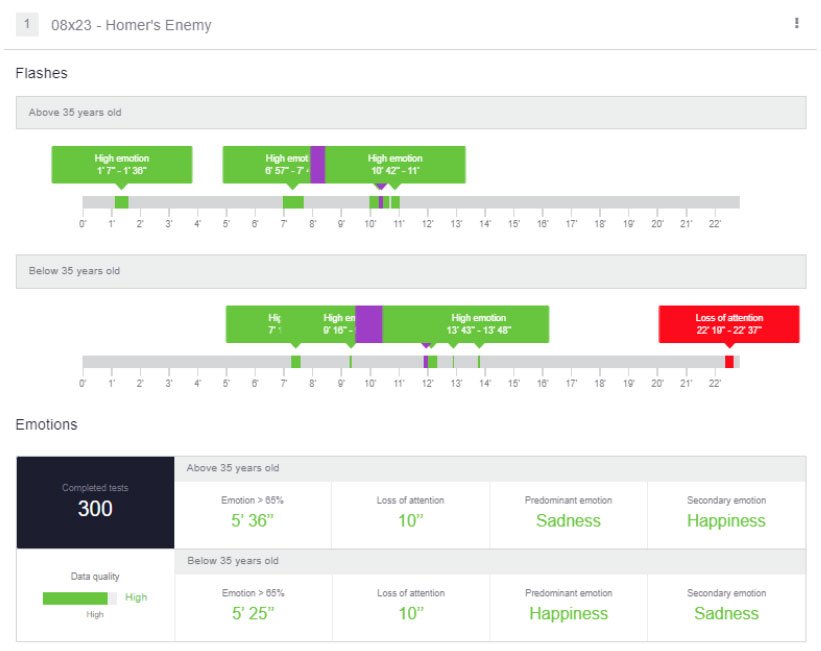
On the other hand, younger people look at it more as a comic show (happiness as the primary emotion) but also have empathy for Frank Grimes’ unjust situation (since sadness as a secondary emotion tends to pair with scenes involving him in the past and his present’s miserable situation).
When it comes to gender, we see some valuable insights:
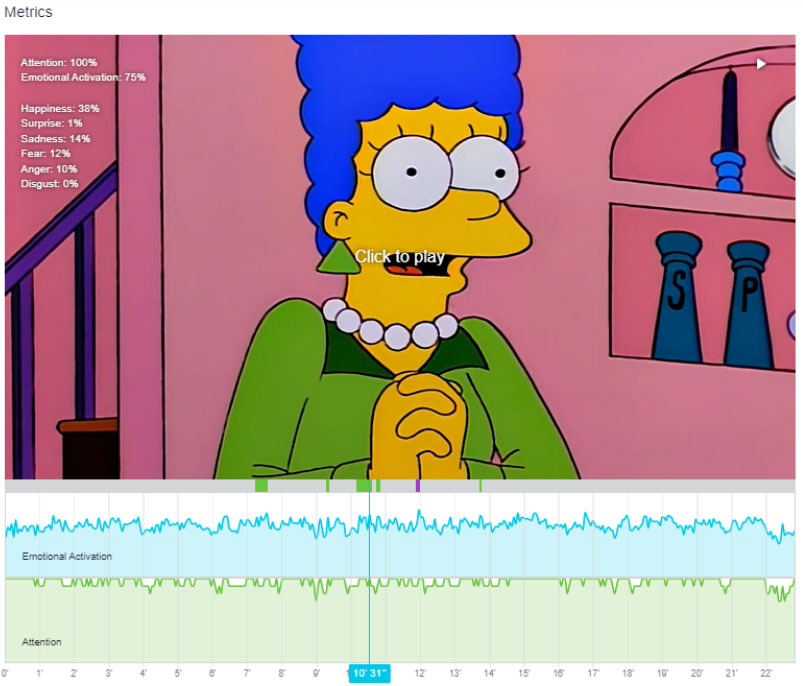
In terms of similarities, we see that both have their highest emotional peak in the same scene (when Frank Grimes visits the Simpson’s home for dinner) and they both experience mainly happiness and sadness. The highest emotional peak scene (around 10:45) is mainly experienced with emotions of joy but there’s also some sadness present since we see how Frank Grimes’ life has been unjust compared to Homer’s.
The loss of attention is similar, with just 10 seconds overall, which points out that both tend to be very engaged with the content. The main loss of attention is at the end of the episode, with the appearance of the credits, and it’s something to be expected in any audiovisual content.
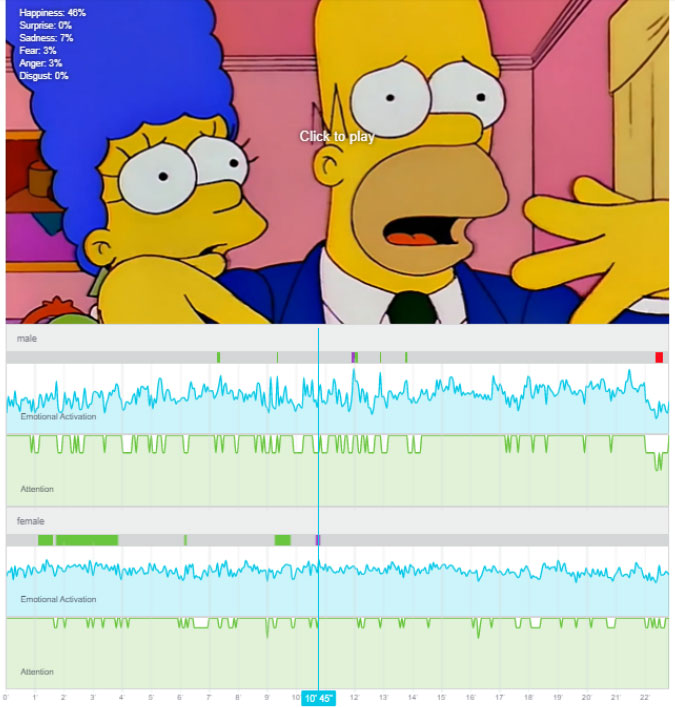
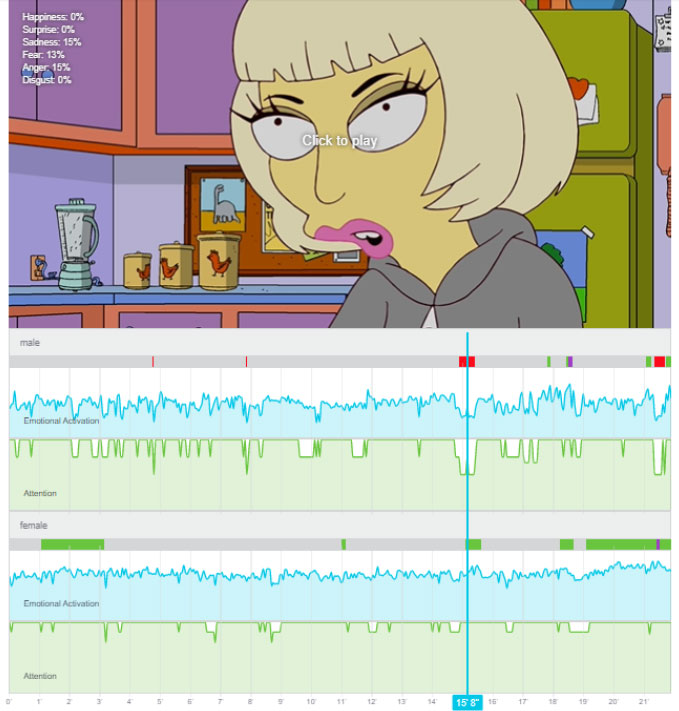
When it comes to the main differences, we see that females experience more emotions throughout the episode (more than 8 minutes of accumulated emotions above the 65% threshold) compared to males (only 3 minutes of emotional activation above the 65% threshold), and females tend to react more in the first half of the episode while males prefer the middle portion.
Lisa Goes Gaga
For this episode, we see that younger generations (below 35 years old) tend to have more emotional reactions (2 and a half minutes of accumulated emotions above the 65% threshold) throughout the episode but also get distracted more easily (higher loss of attention). Lady Gaga was a significant reference during their teenage years and they engage more easily with her than the older generation (above 35 years old) who show fewer emotional spikes and experience more negative emotions than the former (sadness as the predominant emotion).
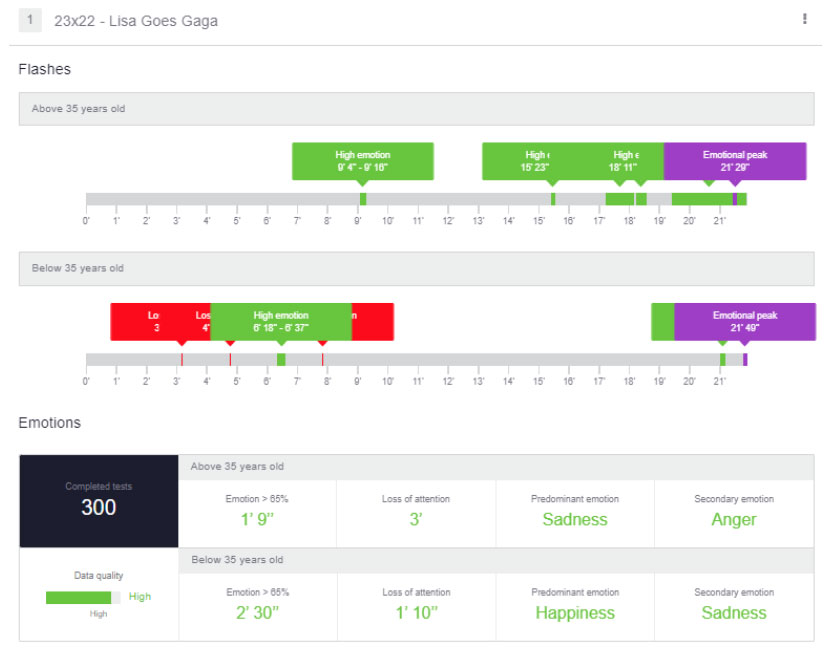
However, both age groups experience losses of attention, although the younger generations tend to elicit them in similar places (see the red flashes) while older ones are more scattered throughout the content. Older generations don’t engage as much (3 minutes of accumulated loss for a 20-minute episode) and they tend to feel anger in certain scenes. This might be because they don’t understand the references or they feel estranged from the content.
In terms of gender, we see that males are less likely to pay attention to the content and their focus losses are scattered throughout the content. This points out that they feel more disengaged with what they’re seeing and their emotional levels tend to remain low. In contrast, females are more engaged (no significant attention loss) and elicit more frequent emotional peaks throughout the content.
Final thoughts
Being able to peak into your audience’s reactions to your content allows you to have valuable information for the creative and financial decision-making process.
With our technology, you can pinpoint specific segments of your content and dive into people’s more visceral reactions, and do something about it. You can learn about the general differences between episodes or dive deep into the reactions of different demographic segments (like age and gender) inside each episode. All these comparisons help us understand how people view the content, what emotions are elicited in each scene, and where they engage or disengage.
In this episode analysis, we saw that the episode “Homer’s Enemy” ranks higher in all the metrics across all segments. There’s more accumulated emotional activation, less loss of attention, and more presence of positive emotions across different age groups and gender compared to the “Lisa Goes Gaga” episode.
Alyze is a tool that allows a new way to measure the performance of TV shows and also assess the quality of specific scenes to ensure the best content is released to the audience. Check out our platform to learn more about what we do.